Heatmap
A heatmap is a graphical representation of data in which values are represented as colors.
Data
Data Source
A list of values for the heatmap.
Data can be added manually as in the following example:
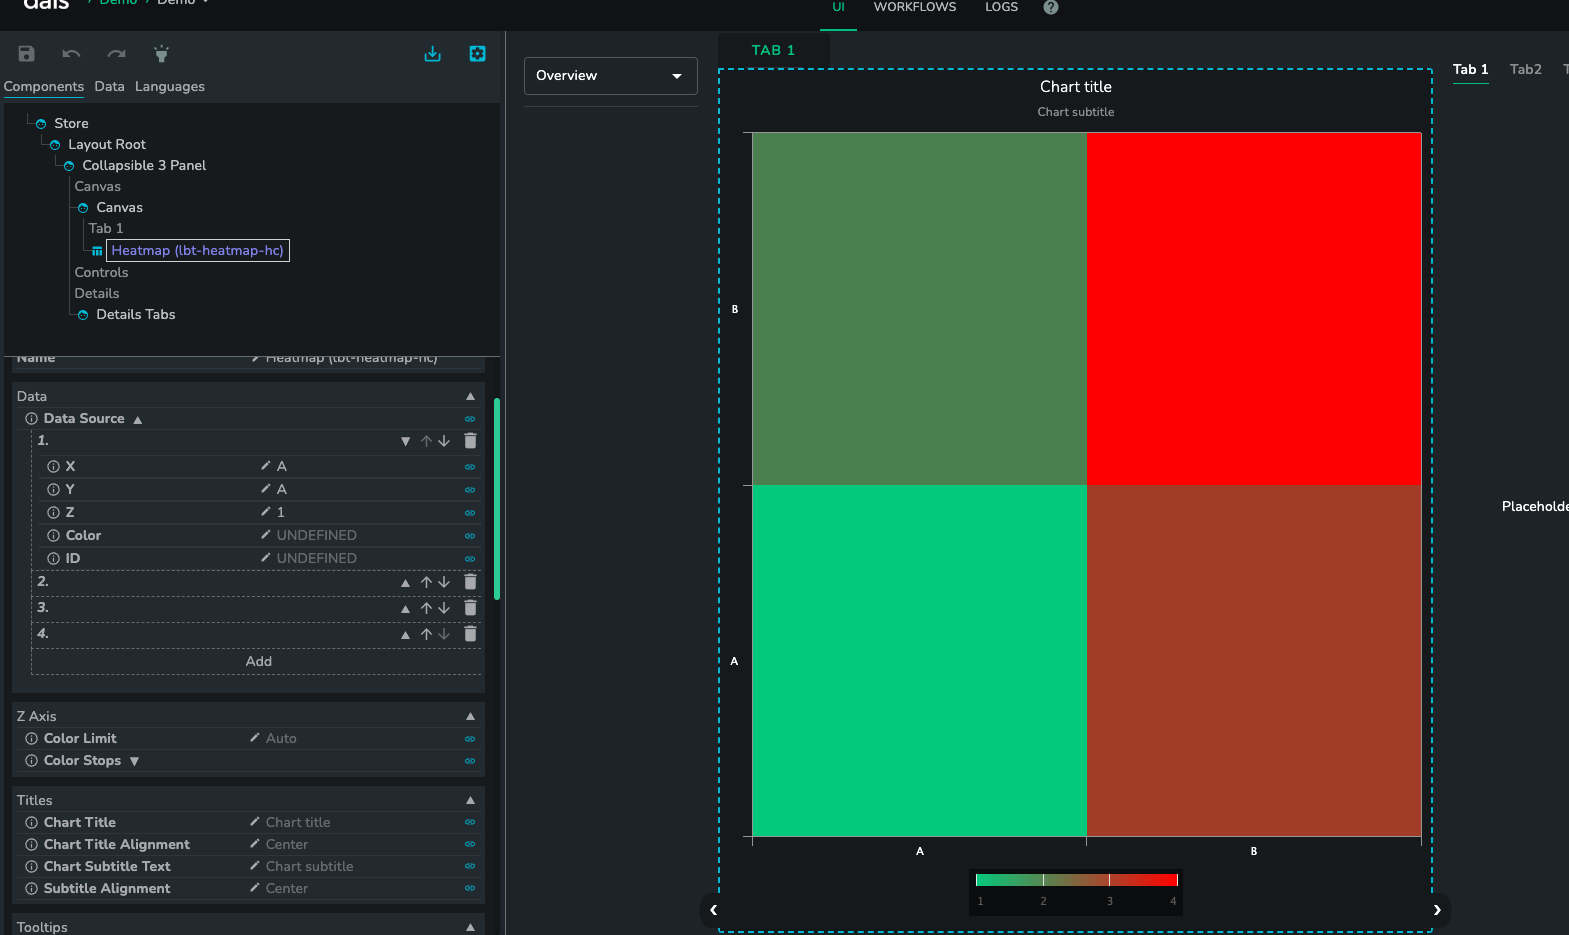
X
The x-axis value of the point.
Y
The y-axis value of the point.
Z
The z-axis value of the point that determines the color of the item.
Color
(optional)
Fixed color override of the point.
ID
(optional)
ID of the point used by point selection)
Alternatively the data can be linked to an external SDD. For example the below SDD produces the same result as in the screenshot above.
{
  "sddFormat": "sdd/table/array-of-objects",
  "version": "1.0.0",
  "definitions": {
    "custom1": {
      "kind": "number",
      "optional": true
    },
    "custom2": {
      "kind": "string",
      "optional": true
    },
    "custom3": {
      "kind": "number",
      "optional": true
    },
    "id": {
      "kind": "number",
      "optional": true
    }
  },
  "data": [
    {
      "custom1": "A",
      "custom2": "A",
      "custom3": 1
    },
    {
      "custom1": "A",
      "custom2": "B",
      "custom3": 2
    },
    {
      "custom1": "B",
      "custom2": "A",
      "custom3": 3
    },
    {
      "custom1": "B",
      "custom2": "B",
      "custom3": 4
    }
  ]
}
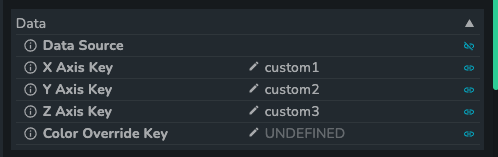
An example of linked SDD with custom keys (explained below) defined:
Aggregation Method
Component level data aggregation method that determines how should the data be aggregated in case there are more than one values with the same X and Y axis values.
The available options are:
NoneSumCountUnique CountAverageMedianVarianceStandard DeviationPercentile(also requires the percentile specified)
Percentile
Only shown if the Percentile options has been selected as the aggregation method
The options are:
5102550759095
X Axis Key
The name of the property to use for determining the x-axis value.
Y Axis Key
The name of the property to use for determining the x-axis value.
Z Axis Key
The name of the property to use for determining the x-axis value.
Color Override Key
(optional)
The name of the property to use for determining the color override.
Z Axis
Color Limit
Should the minimum and maximum be calculated automatically based on the data or not.
Auto(default)Manual
Minimum Value
The minimum value to use for determining the point color based on the Z-axis value.
Maximum Value
The maximum value to use for determining the point color based on the Z-axis value.
Color Stops
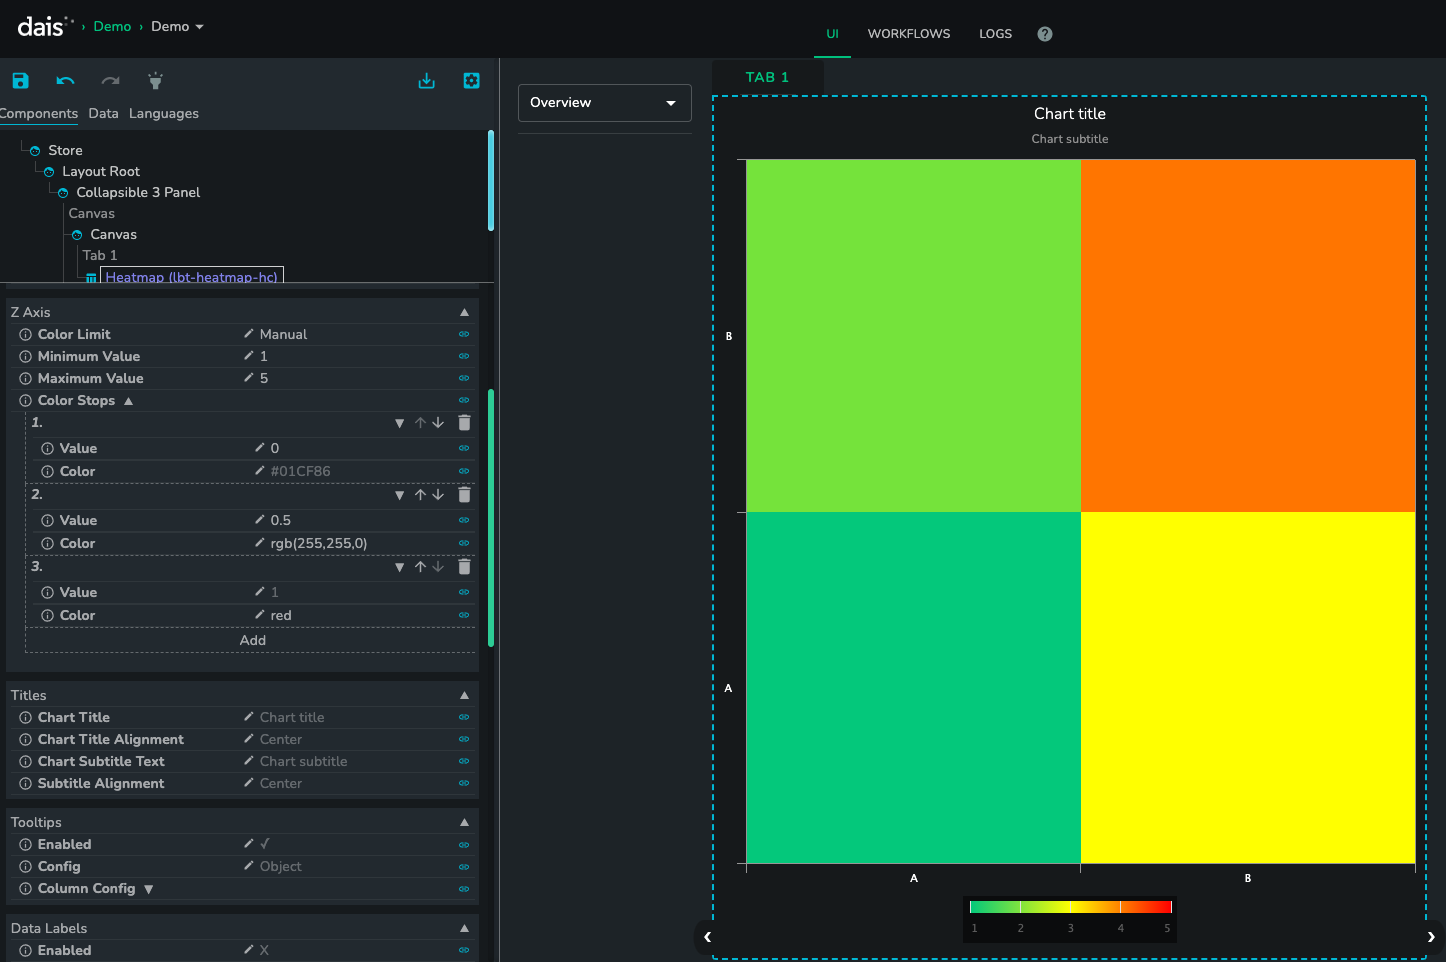
Value and color values to use for determining the point color based on the z-axis value. For the values between the stops a gradient will be applied.
Value
The value at which the color should be applied.
Color
Color to be applies to the value in the following format: HEX (e.g. #01CF86), text color (e.g. "green"), rgb(0,255,0).
An example of custom color stops with overridden min/max values:
Titles
Chart Title
(optional)
The title text to be displayed above the chart.
Chart Title Alignment
(Optional)
How the title should be aligned. Supported values:
LeftCenterRight
Chart Subtitle Text
(optional)
The subtitle text to be displayed above the chart.
Chart Subtitle Alignment
(Optional)
How the title should be aligned. Supported values:
LeftCenterRight
Tooltips
Enabled
Enable or disable tooltips for all data points
Config
Format for a simple tooltip. Specify a suffix or prefix and set the decimal places.
{
  "prefix": "",
  "suffix": "",
  "multiplier": "auto",
  "decimalPlaces": 1,
  "capitalize": true,
  "useLocale": true
}
Column Config
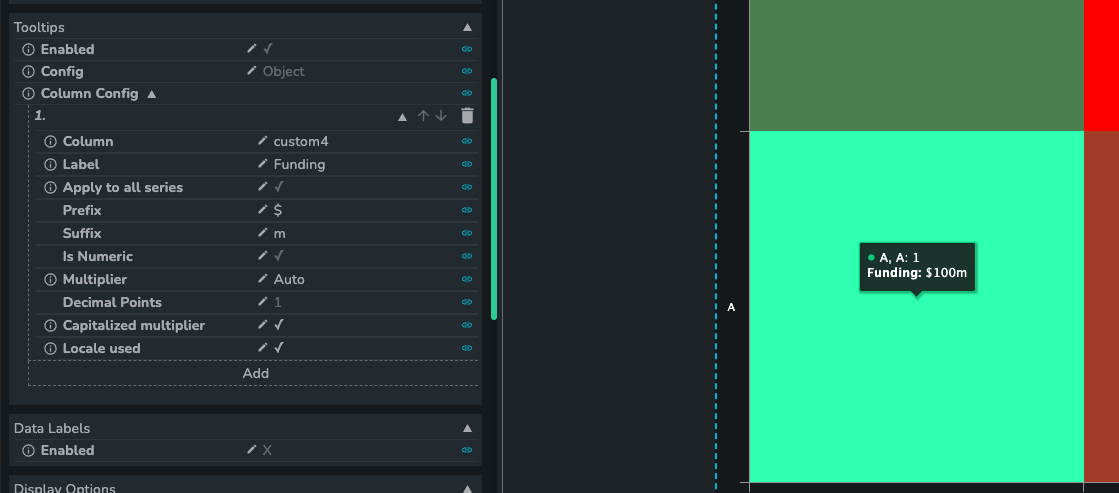
Construct a custom tooltip by combining data from columns in the source data.
Column
Column from the data source to display in the tooltip.
Label
Alias to display instead of the column name.
Apply to all series
Should this column tooltip be displayed for all series?
Applies To Series
Which series should this tooltip schema apply to.
Prefix
Tooltip prefix.
Suffix
Tooltip suffix.
Is Numeric
Is the tooltip numeric? If yes, hide the properties related to numeric tooltips.
Multiplier
Converts the value to the chosen multiplier. For example, the option "Thousands" would convert the value "1000" to "1k".
Decimal Points
Decimal points to add to the number.
Capitalized multiplier
Capitalizes the multiplier value.
Locale used
Should the tooltip be formatted based on user locale?
Custom tooltip example:
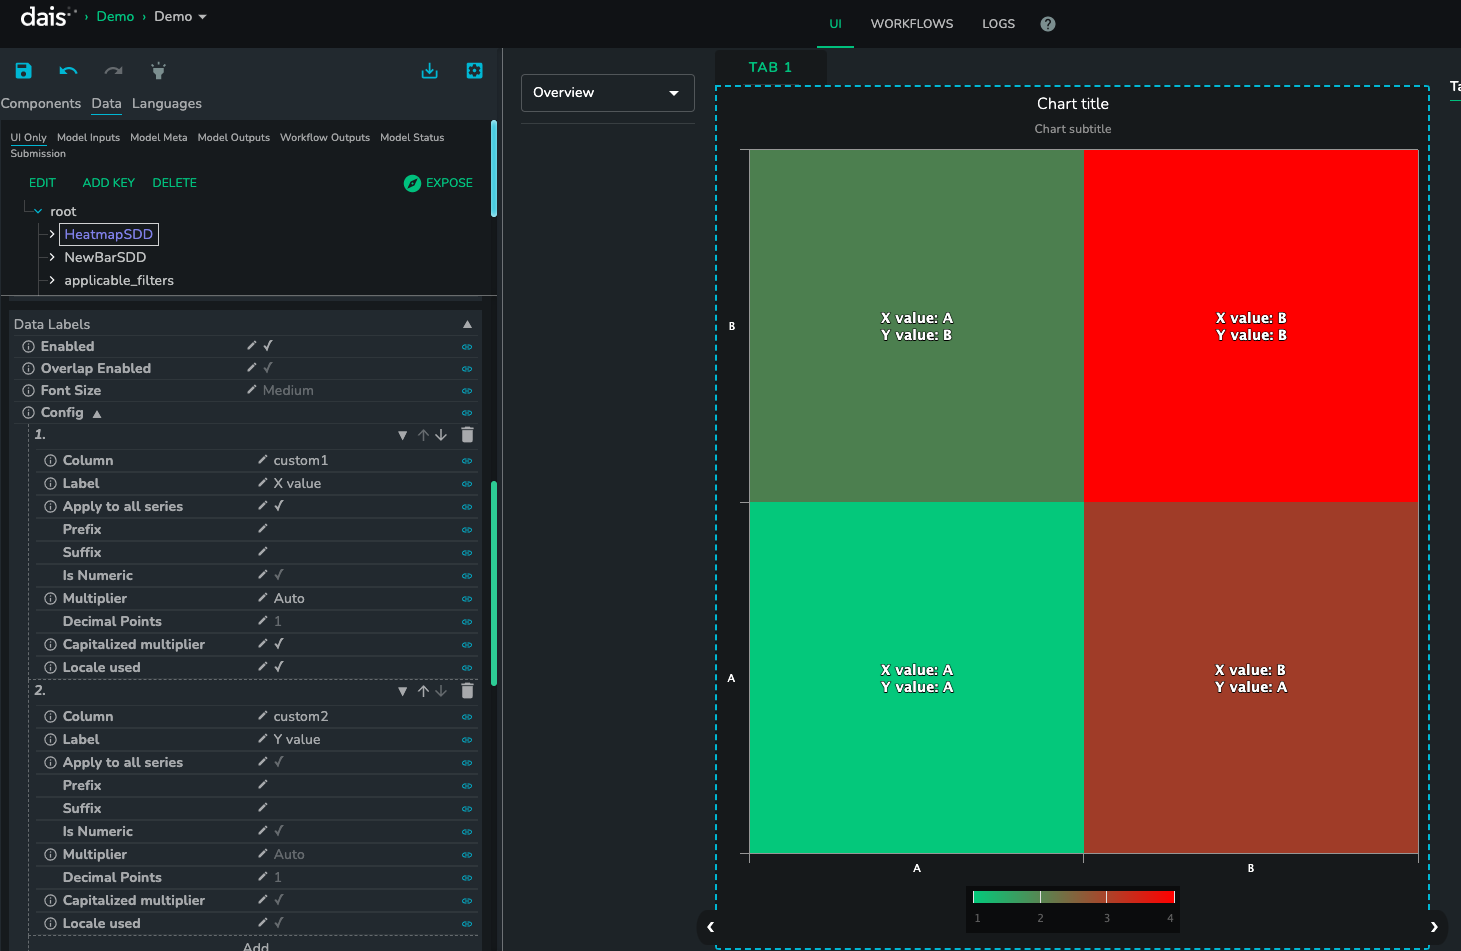
Data Labels
Enabled
Should data labels for the chart series be shown.
Overlap Enabled
Allow data labels to overlap if the is insufficient space.
Font Size
Data label font size.
SmallMediumLarge
Config
Data label configuration.
Column
Column from the data source to display in the data labels.
Label
Alias to display instead of the column name.
Apply to all series
Should this column data label be displayed for all series?
Applies To Series
Which series should this data label schema apply to.
Prefix
Data label prefix.
Suffix
Data label suffix.
Is Numeric
Is the data label numeric? If yes, hide the properties related to numeric data labels.
Multiplier
Converts the value to the chosen multiplier. For example, the option "Thousands" would convert the value "1000" to "1k".
Decimal Points
Decimal points to add to the number.
Capitalized multiplier
Capitalizes the multiplier value.
Locale used
Should the data label be formatted based on user locale?
Display Options
Pan And Zoom
Enable pan and zoom for numeric axis. To zoom, click and hold the left mouse button. To pan, press the "shift" key and drag on the chart.
Minimum Height
The minimum height of the chart in rem units. 2rem by default.
Legend
Enabled
A flag specifying whether the legend should be displayed in the chart.
Orientation
(optional)
Defines the way in which legend items are laid out within the available space. Available options:
horizontalvertical
Defaults to horizontal
Horizontal legend position
(optional)
Defines where the legend sits along the horizontal plane. Available options:
LeftCenterRight
Defaults to center
Vertical legend position
(optional)
Defines where the legend sits along the vertical plane. Available options:
topmiddlebottom
Defaults to bottom
Custom data label example:
X / Y Axis
Enabled
Should the axis values be shown or not.
Title
(optional)
Title to display on the axis.
Type
The type of the axis values.
Categorytext valuesLinearnumeric values that support numeric formattingLogarithmiclogarithmic axis values that support numeric formattingDatetimedate values that support date-time formatting based on date-fns library formatting
Axis On Opposite Side
Display the axis on the opposite side of the chart.
Reverse
Reverse axis values.
Tick Rotation Limit
Limit the rotation of axis ticks (in degrees).
Selection
Type
Options for point selection.
None(point selection is disabled)Single(one point can be selected at a time)Multi(multiple points can be selected at a time when holding down theshiftkey)
Selected Points
Property that the user must like to in order to enabled point selection.
Colored
Boolean value determining if the selected points should be colored or not.
Selected Point Color
The color of the selected points.
Animation
Enabled
Should animation be enabled or not.
Duration
Duration of chart animations (400 milliseconds by default).
Caption
Text
Specify text to display as a caption below the chart.
Alignment
Caption alignment
leftcenterright
Watermark
Enabled
Toggle the watermark on or off. The watermark shows the date and name of a logged-in user.
Text
Extra text to display in the watermark,